Laste ned presentasjonen
Presentasjon lastes. Vennligst vent

2
Hvordan måle sosiale helseulikheter? Litt om enkle mål (RR og RD) og litt om sofistikerte mål (RII og SII) Bjørn Heine Strand 19.05.2008
 og litt om sofistikerte mål (RII og SII) Bjørn Heine Strand")
3
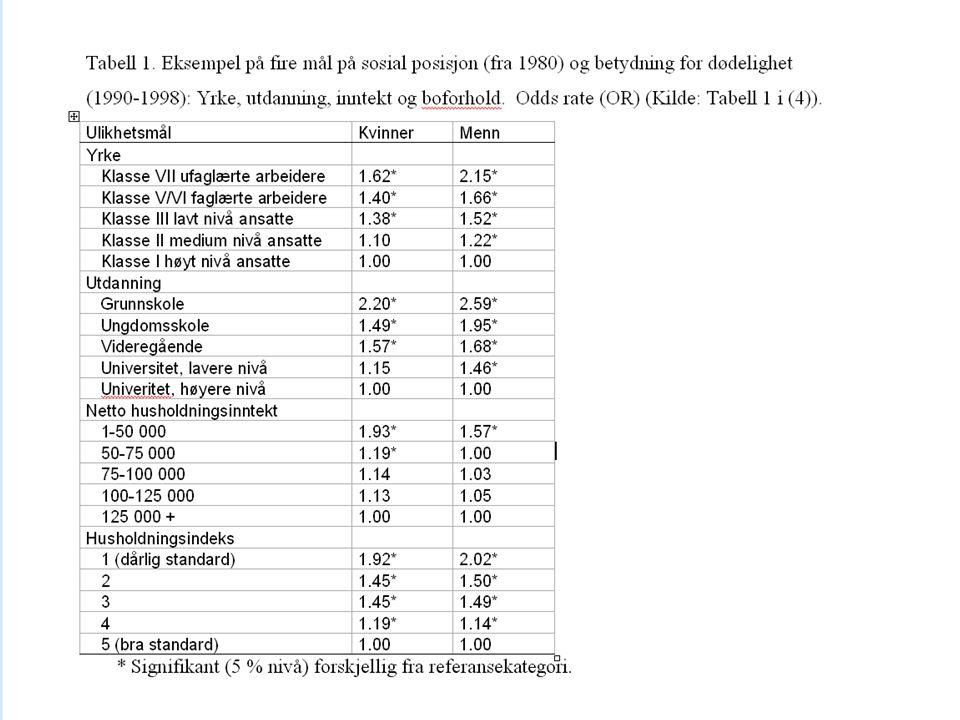
Artikkel som viste store forskjeller i Norge

4
Mål på sosioøkonomisk posisjon Yrke Inntekt Utdanning

6
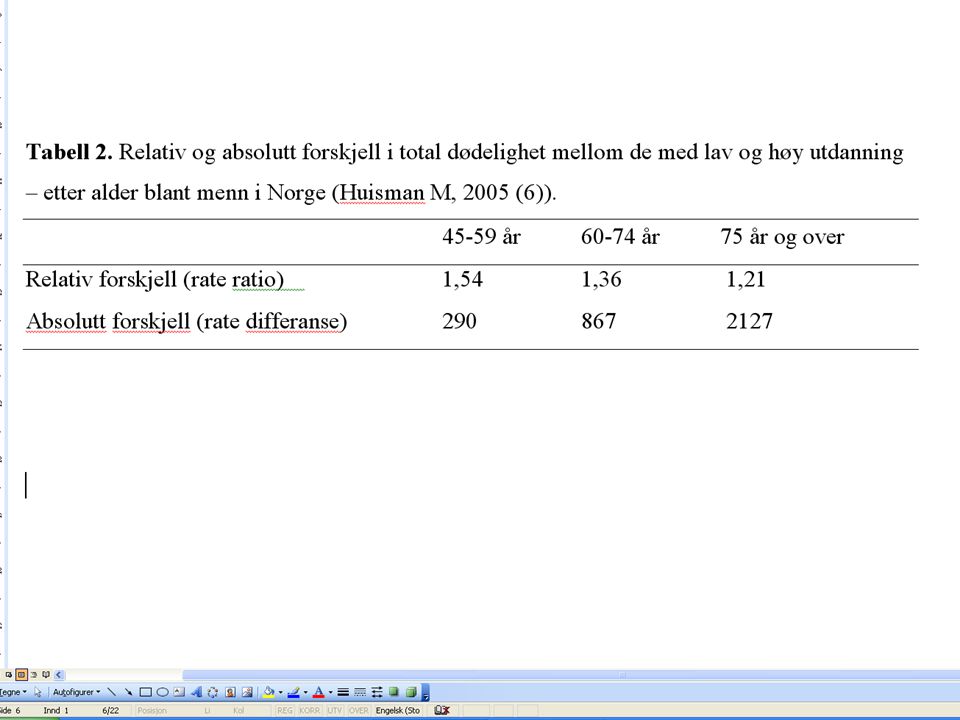
Måling av sosiale forskjeller Relative versus absolutte forskjeller –Enkle mål Risikodifferanse (RD) Relativ risiko (RR, OR) –Sofistikerte mål Relative index of inequality (RII) Slope index of inequality (SII)
 Relativ risiko (RR, OR) –Sofistikerte mål Relative index of inequality (RII) Slope index of inequality (SII)")
9
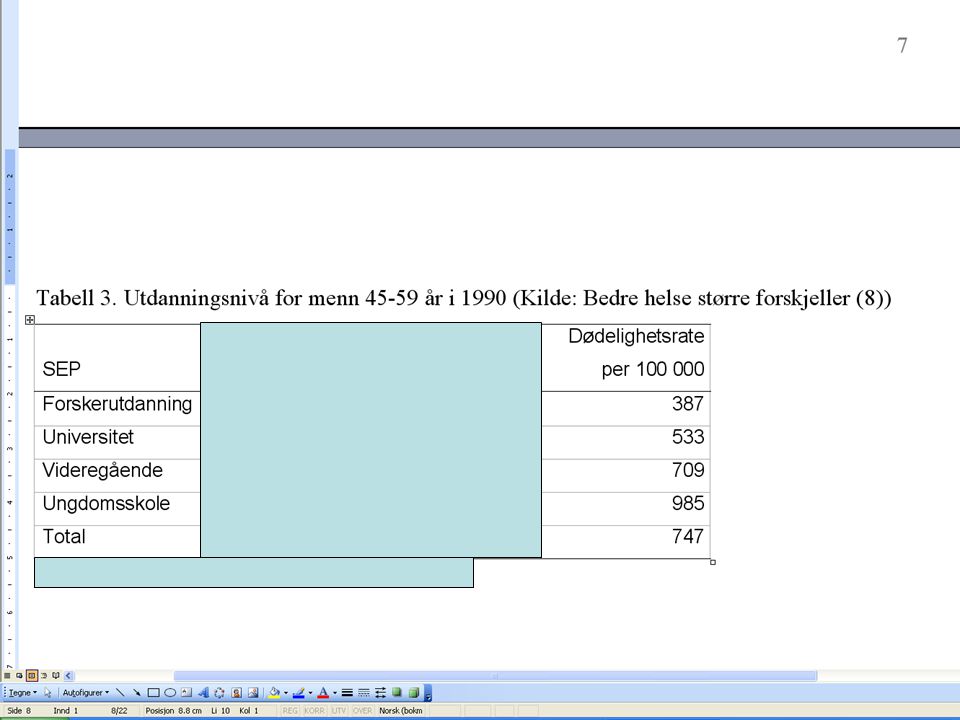
387 985 RD=985-387=598 RR=985/387=2.54

10
387 985 RD=985-387=598 RR=985/387=2.54 MEN, dette tar ikke hensyn til størrelsen på gruppene

11
Hvordan ta hensyn til størrelsen? Sortere alle individer etter status, og skaler 0-1, hvor 0 indikerer høyest status og 1 lavest. Med grupperte data som her Hver gruppe gis en score basert på andel med høyere SEP. Det var 7.2 % med forskerutdanning, og SEPscore blir da 7.2/2=3.6 %.

13
0 10.5

14
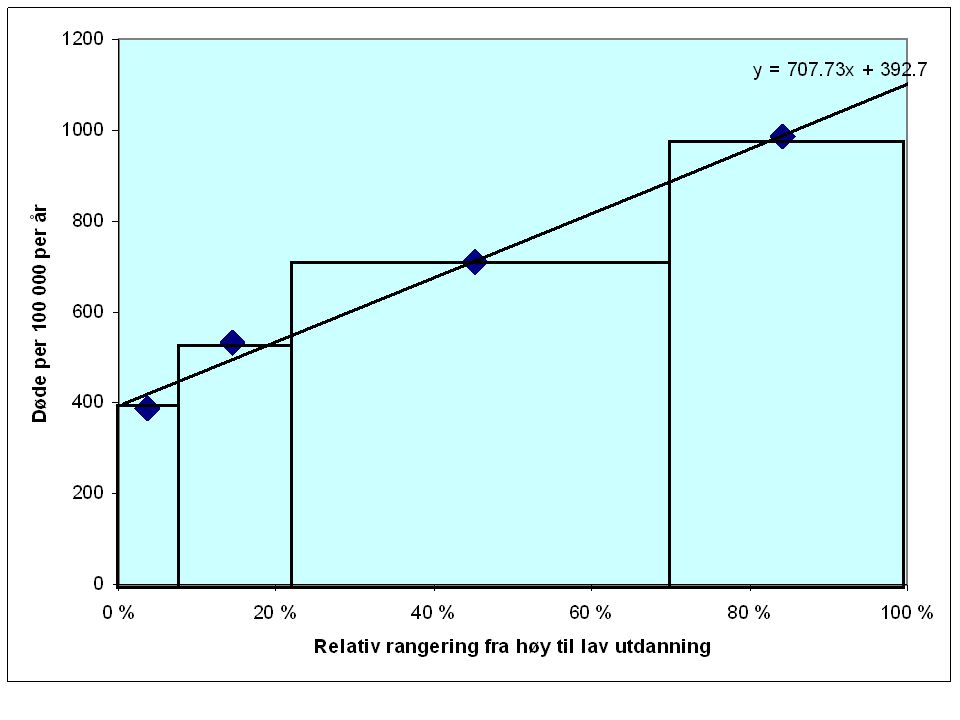
Illustrasjon av SEP-score y = 707.73x + 392.7

15
RII=707.73+392.7/392.7=2.80 SII=707.73+392.7-392.7=707.73

16
RD SII RR RII 598 707 2.5 2.8

17
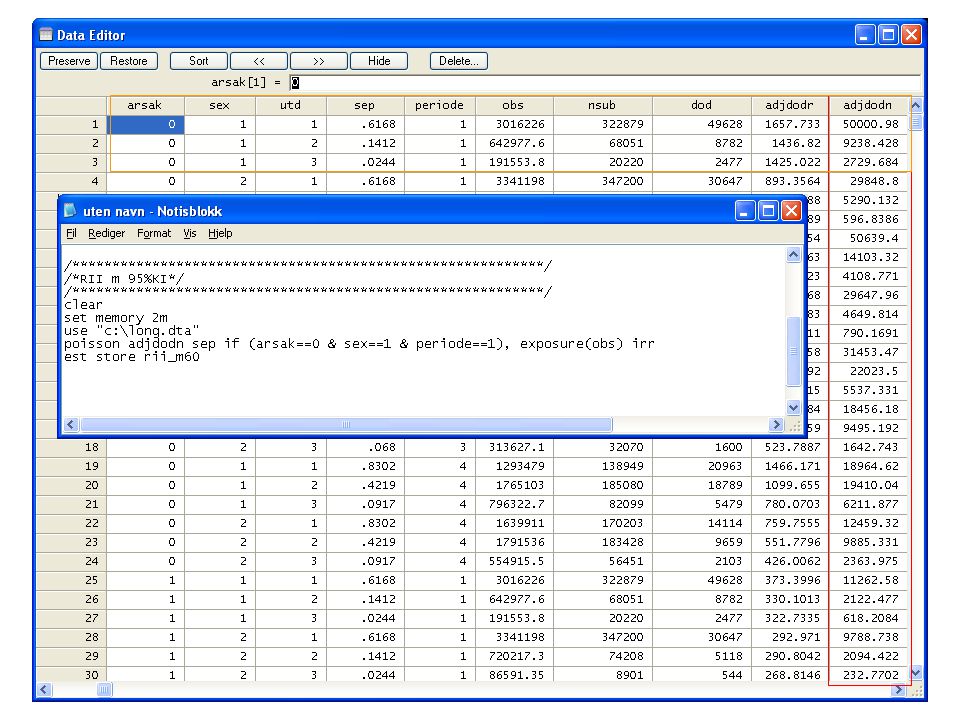
Hvordan beregne RII og SII direkte fra regresjonsmodeller i Stata? Med konfidensintervall? Poissonregresjon kan beregne både RII og SII med konfidesintervall Cox kan beregne RII, men ikke SII

18
Kjapp metode for å beregne SII fra RII: SII=2*MR*(1-RII)/(1+RII)
/(1+RII)")
19
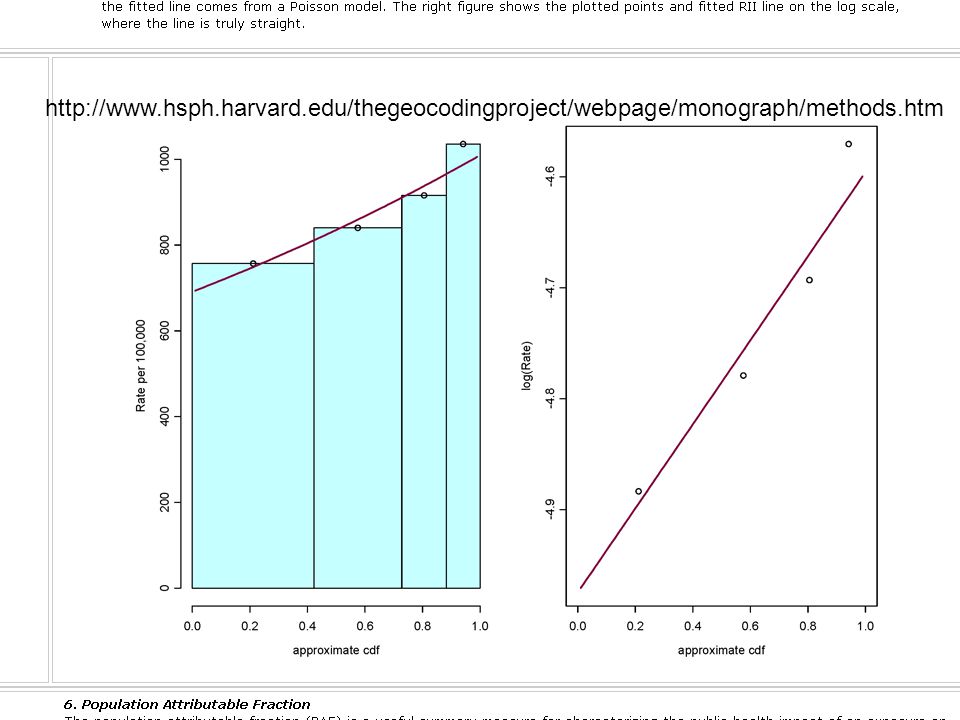
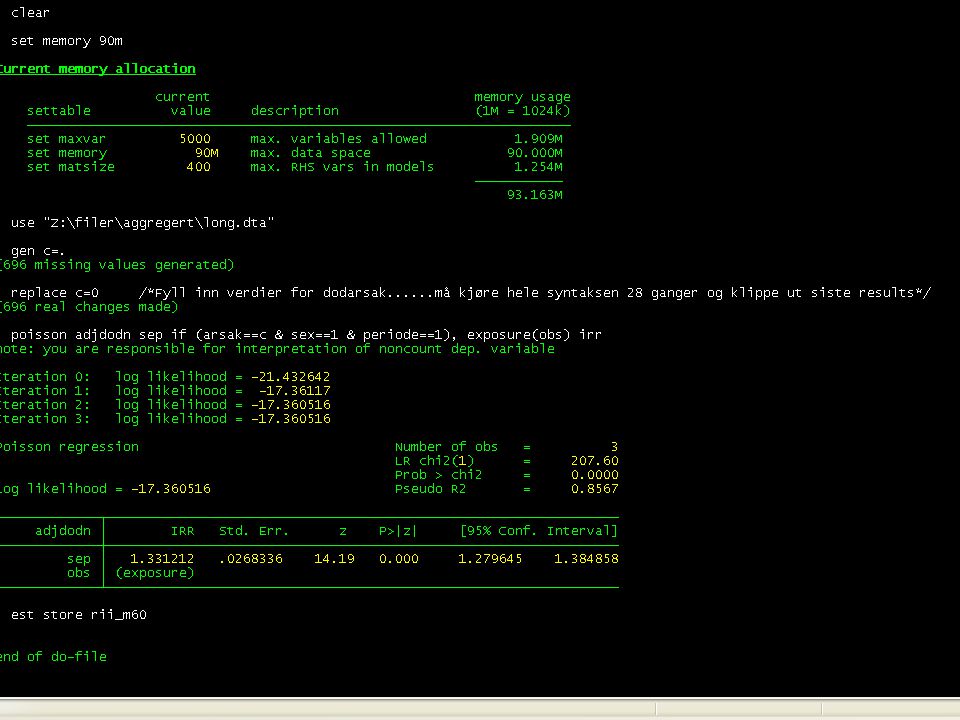
RII The SEP scores were related to mortality in Poisson regressions in the following way: Log(E(Age adj number of deaths)/person years) = a + b*SEP RII is the exponentiated value of the estimated coefficient b from the above Poisson regression
/person years) = a + b*SEP RII is the exponentiated value of the estimated coefficient b from the above Poisson regression")
20
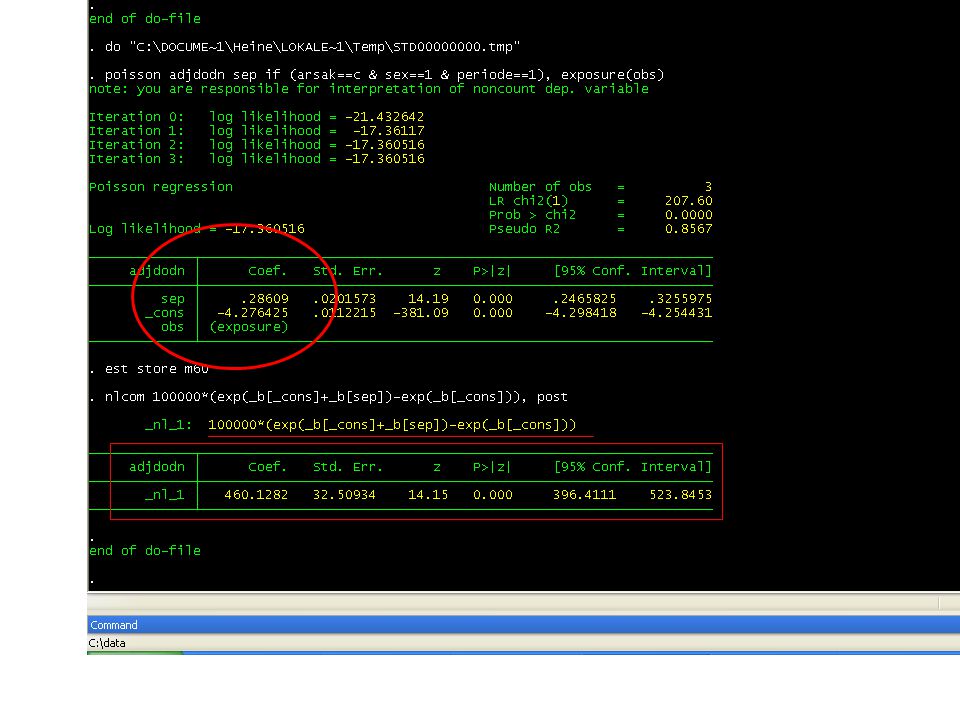
SII The SII was derived from the estimated coefficients a and b from the above Poisson regression in the following way: 100 000*[exp(a+b)-exp(a)]. This post estimation was done using the commando nlcom in Stata which gives the SII estimate with 95% confidence interval directly.
![SII The SII was derived from the estimated coefficients a and b from the above Poisson regression in the following way: *[exp(a+b)-exp(a)].](http://images.slideplayer.no/10/2974399/slides/slide_20.jpg "This post estimation was done using the commando nlcom in Stata which gives the SII estimate with 95% confidence interval directly..")
24
SII nlcom 100000*(exp(_b[_cons]+_b[sep])- exp(_b[_cons])), post
![SII nlcom *(exp(_b[_cons]+_b[sep])- exp(_b[_cons])), post](http://images.slideplayer.no/10/2974399/slides/slide_24.jpg "SII nlcom *(exp(_b[_cons]+_b[sep])- exp(_b[_cons])), post")
25
http://www.hsph.harvard.edu/thegeocodingproject/webpage/monograph/methods.htm
27
Nyttige referanser 1. Mackenbach JP, Kunst AE. Measuring the magnitude of socio-economic inequalities in health: An overview of available measures illustrated with two examples from Europe. Social Science & Medicine 1997;44:757-71. 2. Low A, Low A. Measuring the gap: quantifying and comparing local health inequalities. J Public Health (Oxf ) 2004;26:388-95. 3. Hayes LJ, Berry G. Sampling variability of the Kunst-Mackenbach relative index of inequality. J Epidemiol Community Health 2002;56:762-5. 4. Oakes JM, Kaufman JS. Methods in social epidemiology. San Francisco: Jossey-Bass; 2006. 5. Sosial ulikhet i helse. En faktarapport. Oslo: Nasjonalt folkehelseinstitutt.; 2007. Rapport 2007:1. 6. Blakely T, Tobias M, Atkinson J. Inequalities in mortality during and after restructuring of the New Zealand economy: repeated cohort studies. BMJ 2008;336:371-5.
 2004;26: Hayes LJ, Berry G. Sampling variability of the Kunst-Mackenbach relative index of inequality. J Epidemiol Community Health 2002;56: Oakes JM, Kaufman JS. Methods in social epidemiology. San Francisco: Jossey-Bass; Sosial ulikhet i helse. En faktarapport. Oslo: Nasjonalt folkehelseinstitutt.; Rapport 2007:1. 6. Blakely T, Tobias M, Atkinson J. Inequalities in mortality during and after restructuring of the New Zealand economy: repeated cohort studies. BMJ 2008;336:")
28
Nyttige lenker Bra side med forklaringer og eksempler! http://www.hsph.harvard.edu/thegeocodin gproject/index.htmhttp://www.hsph.harvard.edu/thegeocodin gproject/index.htm EU-rapport om måling av sosial ulikhet: http://ec.europa.eu/health/ph_projects/199 8/monitoring/fp_monitoring_1998_frep_06 _a_en.pdfhttp://ec.europa.eu/health/ph_projects/199 8/monitoring/fp_monitoring_1998_frep_06 _a_en.pdf

Liknende presentasjoner


>")


