Laste ned presentasjonen
Presentasjon lastes. Vennligst vent

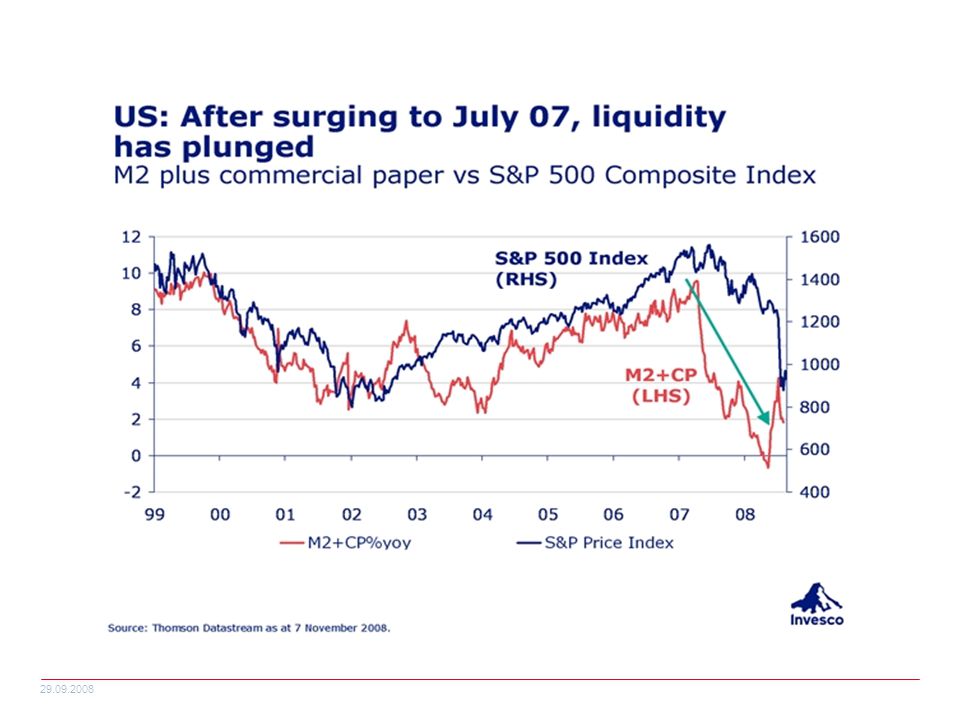
1
DESEMBERKONFERANSEN 2008 - Kristian Siem SS7 New Vessels
Seven Oceans The Seven Oceans is a state-of-the-art purpose built deepwater rigid pipelay vessel fitted with an advanced flexible pipelay system, capable of operating in water depths of 3,000m, with up to 400t top tensioner and a 3,500t main reel. Seven Seas The Seven Seas is a new flexible deepwater pipelay and construction vessel, with 400t top tensioner VLS, 400t J-lay 400/350t crane and 3,000t carousel. It is capable of operating in water depths of 3,000m.

2
Subsea Field Development
. Subsea Field Development Rev 1

3
AKTIVITETSNIVÅ FREMOVER AKTIVITET PÅ NORSK SOKKEL
DISPOSISJON FINANSKRISEN OLJEPRISEN AKTIVITETSNIVÅ FREMOVER AKTIVITET PÅ NORSK SOKKEL Rev 1

5
UTVIKLING I OLJEPRISEN FRA 1985 FREM TIL JULI 2008

6
UTVIKLING I OLJEPRISEN SIDEN TOPPNIVÅET JULI 2008

7
Oil price forecasts

8
E&P Spending vs. Previous Years Oil Price
“We estimate that contracts worth almost US$ 0.5 tn will be awarded to oil service companies in the next two years” Goldman Sachs talking about the outlook for the oil service industry As the example of investments by Petrobras shows, the capital needed to support such a demand is huge! These investments would never have taken place in such a grand scale had it not been that the oil price is historically high. With lower oil price the developments would likely had been phased out over time, allowing Petrobras to use the same rigs at different fields. The Petrobras example gives a strong indication why the CAPEX growth is so strong. The CAPEX growth is due to three factors; Deepwater E&P taking over from shallow water. More fields being developed. Strong increase in the cost of doing business in the oil and gas industry. According to Cambridge Energy Research Institute (CERA) the cost has doubled in the industry from 2005 till now, hence the CAPEX growth. As the graph shows, there is a very strong correlation between the oil price and the capex growth. The CAPEX growth lags with one year, which shows that it follows oil price developments rather strict. The problem with such a strong correlation between the oil price and the CAPEX is that when the oil price falls, so will the capital expenditure, so that the industry always seems to have problems supplying enough oil to the market because they are so quick at cutting cost. It is a good way for the oil companies to reduce the likelihood of excessive supply. The search for oil in deepwater regions while increasing the capital expenditure has also introduced a few technological challenges as the increased pressure and temperature on the seabed is often higher in deepwater. This have increased the need for insulation and strengthening of the pipelines used. As an example at 300 meters depth the oil flows to the surface without adding any pressure, while at 2000 metres you need to add 200 bars to get the oil flowing to the surface. Also often the pressure is higher the deeper you get, which creates pressure on the pipelines and the welding, which are different to shallow water developments. The technological developments in the vendor market is most of the time driven by the operators quest to produce more oil and gas both in mature areas and more frontier areas like the arctic and the deepwater regions. As such you can argue that it is the capital investments that drive the technological development. On average the oil industry participants are slow at adapting new technologies, and invest in them although there are exceptions to the rule. Sometimes the technological developments are a result of Government restrictions, like the NOx tax, and then the government might be willing to invest in projects working to reduce these emissions. The last couple of weeks we have seen the oil price rise above 130 dollars a barrel a doubling over the last 12 months. What then is to happen to the industry if the oil prices falls back to 50 dollars a barrel! With an oil price around 50 dollars a slight panic is likely to reach the industry. With the costs of doing business in the oil and gas industry having doubled since 2005 and still increases a number of smaller field developments that will be put on-stream with an oil price of 80 dollars a barrel or more, will be put on hold if the price where to fall to 50 dollars a barrel. The oil companies uses a price between 50 and 70 dollars to calculate if a field development is commercial or not. A price range which has increased from around 20 dollars five years ago. The increase is due to cost and uncertainty whether the high oil price we see today is sustainable. Hence with an oil price around 50 dollars, the IOC’s will need to put some projects aside awaiting higher oil prices again. Putting projects on hold will lead to lower utilization of our subsea vessels and lower revenue for the entire oil service sector. However at the moment the market looks very strong, with increasing development and demand for energy from a number of developing countries, while the industry seems to be struggling to supply enough oil to the market, which has given us high oil prices. Source: IEA, Handelsbanken Capital Markets Rev 1
 the cost has doubled in the industry from 2005 till now, hence the CAPEX growth. As the graph shows, there is a very strong correlation between the oil price and the capex growth. The CAPEX growth lags with one year, which shows that it follows oil price developments rather strict. The problem with such a strong correlation between the oil price and the CAPEX is that when the oil price falls, so will the capital expenditure, so that the industry always seems to have problems supplying enough oil to the market because they are so quick at cutting cost. It is a good way for the oil companies to reduce the likelihood of excessive supply. The search for oil in deepwater regions while increasing the capital expenditure has also introduced a few technological challenges as the increased pressure and temperature on the seabed is often higher in deepwater. This have increased the need for insulation and strengthening of the pipelines used. As an example at 300 meters depth the oil flows to the surface without adding any pressure, while at 2000 metres you need to add 200 bars to get the oil flowing to the surface. Also often the pressure is higher the deeper you get, which creates pressure on the pipelines and the welding, which are different to shallow water developments. The technological developments in the vendor market is most of the time driven by the operators quest to produce more oil and gas both in mature areas and more frontier areas like the arctic and the deepwater regions. As such you can argue that it is the capital investments that drive the technological development. On average the oil industry participants are slow at adapting new technologies, and invest in them although there are exceptions to the rule. Sometimes the technological developments are a result of Government restrictions, like the NOx tax, and then the government might be willing to invest in projects working to reduce these emissions. The last couple of weeks we have seen the oil price rise above 130 dollars a barrel a doubling over the last 12 months. What then is to happen to the industry if the oil prices falls back to 50 dollars a barrel! With an oil price around 50 dollars a slight panic is likely to reach the industry. With the costs of doing business in the oil and gas industry having doubled since 2005 and still increases a number of smaller field developments that will be put on-stream with an oil price of 80 dollars a barrel or more, will be put on hold if the price where to fall to 50 dollars a barrel. The oil companies uses a price between 50 and 70 dollars to calculate if a field development is commercial or not. A price range which has increased from around 20 dollars five years ago. The increase is due to cost and uncertainty whether the high oil price we see today is sustainable. Hence with an oil price around 50 dollars, the IOC’s will need to put some projects aside awaiting higher oil prices again. Putting projects on hold will lead to lower utilization of our subsea vessels and lower revenue for the entire oil service sector. However at the moment the market looks very strong, with increasing development and demand for energy from a number of developing countries, while the industry seems to be struggling to supply enough oil to the market, which has given us high oil prices. Source: IEA, Handelsbanken Capital Markets. Rev 1.")
9
AKTIVITETSNIVÅ - Ability of clients to finance projects
National oilcos National strategic interest will often over-ride short-term economics. Credit Suisse survey shows marginal increase in capex plans from 2008 to 2009 for selected NOCs (excluding Russians - Gazprom & Lukoil). Major oilcos Most are still cashflow positive after capex & dividends in $60-80/bbl environment. Credit Suisse survey shows no noticeable decline in capex plans from 2008 to 2009. Independent oilcos Most larger IOCs AA-rated & ability to leverage not particularly limited. Smaller IOCs typically use higher oil price hurdles & likely to have greater funding problems. Smaller IOCs estimated to account for only 5-10% of offshore E&P spending (but 20% of S7 revenue in ). Credit Suisse survey shows 29% decline in US independent capex plans from 2008 to 2009. Source: HSBC
. Major oilcos. Most are still cashflow positive after capex & dividends in $60-80/bbl environment. Credit Suisse survey shows no noticeable decline in capex plans from 2008 to Independent oilcos. Most larger IOCs AA-rated & ability to leverage not particularly limited. Smaller IOCs typically use higher oil price hurdles & likely to have greater funding problems. Smaller IOCs estimated to account for only 5-10% of offshore E&P spending (but 20% of S7 revenue in ). Credit Suisse survey shows 29% decline in US independent capex plans from 2008 to Source: HSBC.")
10
Project hurdle rates by project type
Total states its Canada oil sands projects need an oil price of $90 a barrel BP has shelved plans for its $500m Delaware LNG facility, arguing "market conditions do not support such a project near term". At current oil prices, most of S7’s target prospects are still economic but this is becoming marginal.

11
World Oil Supply & Oil Price
Reserve Replacement Ratio The problems finding enough oil, which has lead to the Reserve Replacement Ratio (RRR) falling from 140 % in 1998 to 80% last year, is one reason the oil price have reached unprecedented levels recently. Another key explanation why the industry seems to struggle with supplying enough oil to the market and why the oil price has risen quite substantially the last 4 -5 years, and doubled the last 12 months is the economic development in countries like China and India. Searching for oil and in deepwater regions and the Arctic greatly increases the overall cost of producing oil and gas and is thought to be another key driver explaining the oil price increases WE have seen the last 3-4 years, although at present levels the oil price is way above the cost of exploring and produce oil and gas in deepwater regions, or on oil sand rich Canadian territory. Looking at the oil sand in Canada WE see the urge to find more oil reserves as a number of the International Oil Companies (IOC’s) have entered the region in a quest to find more oil to produce, even though it is very expensive to extract and very energy intensive to produce, which makes it very harmful to the environment. As the find and producing oil is becoming more costly the IOC’s have been forced to increase the capital expenditure in order to find more oil and gas. As one of the graphs later on will show, the industry is expected to increase it spending on Exploration & Production by four times from 2000 to 2010, an increase never seen before in a such a short time span as a result of increased cost and difficult to reach oil and gas. Because exploring for oil and gas are getting more and more expensive we are likely to see an increased consolidation trend over the next five year period. But unlike the late 1990’s where the super majors merged I think we this time will see that most of the consolidation will take place between medium sized, like the StatoilHydro merger and small sized companies, as it is easier to attract external capital if you are big and influential. Being a National Oil Company (NOC) gives you a better access to capital. As we have seen recently there is a trend among resource rich nations to nationalize their oil and gas resources on behalf of the NOC’s increasing their reserve base, while reducing that of the IOC’s. Supporting the NOC’s is a main driver for OPEC as countries with strong NOC presence have a tendency either to join OPEC or play alongside OPEC as they acting as a swing producer. As the two graphs on the bottom shows, the NOC’s have increased their share of global production from 2003 a trend we expect will continue. The challenge with NOC taking over more and more resources and being in charge of more and more production is that NOC with the exception of Petrobras is less efficient oil producers than the IOC’s. At a time where the market needs all the oil that can be supplied this reduced supply and driver the price even higher. Lately it looks like OPEC has become greedy with regards to the oil price. As most of the OPEC oil has a cost well below 10 dollars a barrel, OPEC is hovering in on the oil price we are experiencing today. As OPEC blames increased risk premiums and traders for driving up the oil price as an excuse not to increase production. As the effect on the market is the same if the price is fundamentally driven or driven by speculators the question is if OPEC is just using this as an excuse not to show that they simply do not have any spare capacity anymore? Source: Handelsbanken Markets Rev 1
 falling from 140 % in 1998 to 80% last year, is one reason the oil price have reached unprecedented levels recently. Another key explanation why the industry seems to struggle with supplying enough oil to the market and why the oil price has risen quite substantially the last 4 -5 years, and doubled the last 12 months is the economic development in countries like China and India. Searching for oil and in deepwater regions and the Arctic greatly increases the overall cost of producing oil and gas and is thought to be another key driver explaining the oil price increases WE have seen the last 3-4 years, although at present levels the oil price is way above the cost of exploring and produce oil and gas in deepwater regions, or on oil sand rich Canadian territory. Looking at the oil sand in Canada WE see the urge to find more oil reserves as a number of the International Oil Companies (IOC’s) have entered the region in a quest to find more oil to produce, even though it is very expensive to extract and very energy intensive to produce, which makes it very harmful to the environment. As the find and producing oil is becoming more costly the IOC’s have been forced to increase the capital expenditure in order to find more oil and gas. As one of the graphs later on will show, the industry is expected to increase it spending on Exploration & Production by four times from 2000 to 2010, an increase never seen before in a such a short time span as a result of increased cost and difficult to reach oil and gas. Because exploring for oil and gas are getting more and more expensive we are likely to see an increased consolidation trend over the next five year period. But unlike the late 1990’s where the super majors merged I think we this time will see that most of the consolidation will take place between medium sized, like the StatoilHydro merger and small sized companies, as it is easier to attract external capital if you are big and influential. Being a National Oil Company (NOC) gives you a better access to capital. As we have seen recently there is a trend among resource rich nations to nationalize their oil and gas resources on behalf of the NOC’s increasing their reserve base, while reducing that of the IOC’s. Supporting the NOC’s is a main driver for OPEC as countries with strong NOC presence have a tendency either to join OPEC or play alongside OPEC as they acting as a swing producer. As the two graphs on the bottom shows, the NOC’s have increased their share of global production from 2003 a trend we expect will continue. The challenge with NOC taking over more and more resources and being in charge of more and more production is that NOC with the exception of Petrobras is less efficient oil producers than the IOC’s. At a time where the market needs all the oil that can be supplied this reduced supply and driver the price even higher. Lately it looks like OPEC has become greedy with regards to the oil price. As most of the OPEC oil has a cost well below 10 dollars a barrel, OPEC is hovering in on the oil price we are experiencing today. As OPEC blames increased risk premiums and traders for driving up the oil price as an excuse not to increase production. As the effect on the market is the same if the price is fundamentally driven or driven by speculators the question is if OPEC is just using this as an excuse not to show that they simply do not have any spare capacity anymore Source: Handelsbanken Markets. Rev 1.")
12
Medium-term SURF World Market Demand: Annual Average Capex 2008-2012
Subsea 7’s Target Market $16.2bn $5.8bn +45% $4.4bn $11.2bn $2.6bn $5.3bn $1.0bn <250m Water Depth: $14.3bn m Water Depth: $4.3bn Now $6.4bn 1000m+ Water Depth : $7.0bn Total Water Depth : $25.6bn Source: Infield Systems

13
Norwegian Subsea Market 2006 - 2012
In addition the IRM/Survey market will tender $ million. The total value of the market 2008 – 2012 is estimated at $ 10,5 bn

14
Norge-Subsea Market 2008 – 2012 Split on Operators

15
Norge-Market Value per Segment - MUSD

16
The Siem Industries Group
33.7% 44.9% 71.6% Siem Offshore Net income*: $122m Subsea 7 Net income*: $214m STAR Reefers Net income*: $46m Siem Car Carriers Net income*: $6.7m 88% German and Swedish Industries *2007 data

17
The Siem Group Values Honest, High Quality and Profitable
Reliable, Steady and Predictable Partner. Long term approach Acts quickly to understand and solve problems The Siem Group has the financial and management strength and confidence to build businesses for the long term.

18
Siem Gruppens investeringer I Norge siden 2000
NOK 1000 Fartøys ordre 24 skip NOK 11,500 Ny bedrift Vigra spolbase Bygning SS7 kontor Stavanger Totalt (+innkøå/utstyr) NOK 11,800 Antall ansatte personer Kontorer: Kristiansund, Grimstad, Kristiansand, Stavanger, Bergen, Rovde, Oslo Forskning bassert I Norge.
 NOK 11,800. Antall ansatte 1000 personer. Kontorer: Kristiansund, Grimstad, Kristiansand, Stavanger, Bergen, Rovde, Oslo. Forskning bassert I Norge.")
19
Chevron (Cabinda Gulf Oil Company) – Lobito Tomboco, Angola
Key Facts Team of 70 people (10 Nationalities) 3 companies set up 83 contracts awarded – 28 within Angola – 55 out-with Angola 220 purchase orders placed 304 separate shipments by air and 173 shipments by sea Set up spoolbase in Luanda Operations run from 3 ports – Soyo, Luanda, Lobito – 280 port calls 1,000 plus vessel days – Seven Navica, Toisa Perseus & Surveyor were operating for over a year
![]()
20
Luanda Spoolbase

21
Spoolbases / Bundle Fabrication Facilities
Luanda, Angola Wick, Scotland Ubu, Brazil Vigra, Norway Port Isabel , Texas Rev 1

22
Vigra Welding Hall

23
Seven Oceans – Reeled Pipelay Vessel

24
Seven Oceans – Reeled Pipelay Vessel

25
Seven Seas - Pipelay and Construction

26
Construction and Pipelay Vessels
Vessel Owned Vessel Chartered Lochnagar Skandi Neptune Seven Seas Seven TBN Kommandor 3000 Toisa Perseus Seven Sisters Seven Navica Seven Oceans Skandi Seven Subsea Viking Normand Seven Skandi Bergen Rev 1

27
Diving Support Vessels
Vessel Owned Vessel Chartered Seven Pelican Toisa Polaris Rockwater 1 Seven Atlantic Rockwater 2 Rev 1

28
Nødvendige aktiviteter som inngår I EPIC kontrakter
ROV support for exploration & production Precise positioning services and solutions Subsea Engineering Solutions Specialist welding division Leading technology in deepwater development .

29
Current Fleet – 197 Vessels
The current fleet of subsea vessels which include; construction/ROV, Diving and Lay vessels is estimated to contain 197 vessels at the start of 2008 according to Strategic offshore. This gives us 48 lay vessels, both rigid and flexible, 52 diving vessels and 97 Construction/ROV vessels. These vessels operate globally depending on where the work and the best margins are obtained. There is almost as many different views on the amount of subsea oriented vessels in the market as there are people counting them, as people differ in what to label a vessel. An example is a vessel ordered as a PSV, put a crane onboard and you can operate it as a construction vessel. A number of the construction vessels are also able to lay flexible lines, thus you can either call it a Lay vessel or a construction vessel. With the exception of the diving vessels most of the fleet of construction and lay vessels are built the last 20 years (3/4). The fleet of diving vessels on the other hand is old, 75% of the diving vessels operating globally today is more than 20 year old which suggests that building new diving vessels are long overdue. In 2007 we saw the market react to this, as about half of the diving vessels now in order where ordered last year. All the different types of vessels operate globally, but there is more need for lay vessels in West Africa and Brazil due to the high activity in these regions today and because deeper water requires more vessel days pr mile laid. In the mature markets like the North Sea and part of GoM is a need for heavy maintenance and repair i.e small and medium sized construction vessels with cranes up of tons. The Companies currently involved in the business are: Subsea 7, Acergy, Technip, and Saipem as the big four, Helix, Allseas, with more focus on export lines, Seastrem, Oceaneering, Hallin, J Ray McDermott, DOF Subsea, Oceanteam, Aker Marine Construction, Global Industries, Bibby as smaller companies and start-ups like Cecon and GDV Subsea. Source: Market info Rev 1
. The fleet of diving vessels on the other hand is old, 75% of the diving vessels operating globally today is more than 20 year old which suggests that building new diving vessels are long overdue. In 2007 we saw the market react to this, as about half of the diving vessels now in order where ordered last year. All the different types of vessels operate globally, but there is more need for lay vessels in West Africa and Brazil due to the high activity in these regions today and because deeper water requires more vessel days pr mile laid. In the mature markets like the North Sea and part of GoM is a need for heavy maintenance and repair i.e small and medium sized construction vessels with cranes up of tons. The Companies currently involved in the business are: Subsea 7, Acergy, Technip, and Saipem as the big four, Helix, Allseas, with more focus on export lines, Seastrem, Oceaneering, Hallin, J Ray McDermott, DOF Subsea, Oceanteam, Aker Marine Construction, Global Industries, Bibby as smaller companies and start-ups like Cecon and GDV Subsea. Source: Market info. Rev 1.")
30
Type of New Builds Split on Delivery
“Short-term we see potential for margin increases, but increased supply will put pressure in margins long-term.” DnB NOR Markets Type of New Builds Split on Delivery “The outlook for the offshore construction industry has improved materially in recent months” Not surprisingly, projected field developments and work required on producing fields decide what type of vessels will be built. Earlier on I talked about the need for new diving vessels as that fleet is very old, and 80-90% of the diving vessels being built will be delivered this year or next. The delivery of the lay vessels are more evenly spread out over the nest four years, while 75% of the construction vessels being built will be delivered the next two. We have seen that in the last six months the order for new subsea vessels have eased, although some vessels are still put in order. It is likely that all the talks about the industry reaching a stage of oversupply at some stage have come into focus. Kristian Siem, our chairman and former CEO of Acergy have both stated that the vessel market will slow down around 2010 as most of the newbuilds will have been delivered then. With increased focus on reducing emissions the technological developments of the vessels will focus on making the vessels more fuel efficient and reducing the NOx emissions to comply with new environmental regulations. Even though the NOx emissions are only taxed in Norway as of today, we expect to see this implemented by EU within the next 5-10 years. There is also a tendency that the construction vessels get equipped with heavier cranes even though this is not so much a technical development. For operating in Arctic regions we need to see the technology focusing on giving smaller vessels icebreaker capacity to operate in ice covered waters. The vessels with icebreaking capacity today is old and heavy, which make them very little fuel efficient and produces a high degree of toxic emission. Although there are not such vessel being ordered, we now that there are drawings of such a vessel being made. As is typical in booming markets a number of the vessels are built on speculation. Currently 1/3 of the vessels in order are built on speculation, some of them by recognized market participants like DOF while others by more speculative entrants like GDV subsea. Active Subsea, acquired late last year by Trico Marine, which now a controlling stake in DeepOcean built 8 small offshore construction vessels mostly on-spec in hopes of another contractor would by the company when the vessels was near completion at the shipyard which was just what happened. All the new vessels on order clearly increased the overall supply of subsea oriented vessels in the market, but what about the demand? Morgan Stanley Source: Market info Rev 1

31
Recently Awarded Projects
Projects Client Location Block 31 BP Africa $460m Troll B Gas Injection StatoilHydro North Sea $100m Grove Extension Centrica North Sea $70m Grouse, Stamford & Chestnut P2 Venture North Sea $67m Block 12/21c Ithaca North Sea $22m IRM/North Sea Total E&P North Sea $60m Sul Capixaba Petrobras Brazil $200m Cascade / Chinook Petrobras Gulf of Mexico $50m Skarv & Idun BP Norge AS North Sea $265m Block 18 LOF BP Angola $80m Hybrid Extension Petrobras Brazil $390m Vega Troll Norsk Hydro North Sea $340m Peregrino Norsk Hydro / Anadarko Brazil $115m BC-10 Shell Brazil $275m North Sea Shell North Sea $1.1bn This slide represents some of the major projects currently in our backlog. Through improved project execution we have the opportunity to improve the overall financial performance of the company. . Rev 1

32
UTFORDRINGER OG UTVIKLINGS TENDENSER
Dypere vann Større felt Operasjon-personell-fokusering Nasjonalisme Sikkerhet mot terror Lokalt regelverk korrupsjon Skatt

33
NORSK SOKKEL .

34
Subsea 7 Awarded Contracts from 01.01.07

35
2009 Tenders for the 09 -12 Market
2008 Firm Backlog Firm ($) 2009 Tender $1,067 40 % 2009 Tender 2009 Tender $ 2318 $ 2318 $ 2318 $ %
 Tender. $1, % Tender Tender. $ $ $ $ %")
36
2009 StatoilHydro

37
2009 BP 2009 Shell, CoP, ENI, Other operators

38
2009 Tenders and Project Execution: COP + Shell + Others

39
STORE OMRÅDER-STORE DYP-STORE FELT
Almost none of the vessels under construction today are being built to operate in arctic waters. Although a number of them have ice-class, it only means that they are able operate below zero temperatures, not that they any ice-breaking capacity or built to operate km offshore over longer times. Because the USGS has estimated that about 25% of the worlds undiscovered resources might be located in the Arctic the area has seen increased interest recently. The fact that global warming seems to melt the ice covering the Arctic, also increased the possibility for oil and gas extraction there in the future. Operating in the Arctic, starting in the Barents Sea, carries a number of challenges like: Barents is a Russian military zone No proven technology No existing infrastructure Freezing temperatures on the seabed Russian business is more locked than Western. All this makes it a challenge to expand the industry into Russian Arctic territory, but the enormous gas resources should make it more than worthwhile. Taking a closer look at the Barents Sea and neighbouring Kara Sea, we see the magnitude of resources present. The Barents Sea holds about bn barrels of oil equivalents of gas, not including the Prirazlomnoye which is already under development while the Kara Sea contains about bn barrels of oil equivalents of gas. While Shtokman which is 22 times the size of Snøhvit, contains 23 bn barrels of oil equivalents is equivalent of 7 years EU demand for Gas, the resources available in the Kara Sea will supply the EU with gas for more than 50 years assuming today’s demand. If everything goes according to schedule, Gazprom has said that Shtokman will come on-stream in 2013 with LNG production starting in 2014 with the first phase expected at cost of 15 billion dollars, up from previously 12 billion, but we should not be surprised if the actual number came closer to 20 billion. Like Norwegian and Brazilian authorities, the Russian authorities would like to see as much as possible of the equipment that will be used on their oil fields, produced internally. Looking at the subsea oriented vessels operating in Russia, there are only one, Akademik Golitsyn an old construction vessel has been used mainly for survey. However, Russia has a number of shipyards that previously have worked for the Navy building submarines and other naval vessels which we expect will focus on building offshore and subsea vessels in the coming years. and with the intent to build as much as possible within Russia that this is one of the key drivers to become partner in the Shtokman development. With the amount of work offshore Russia the next 20 years also after phase 1 of Shtokman is developed, it is likely that Russian built vessels will be occupied in Russia for most of the time. Because of the uncertainty relating to the Scope of Work on Shtokman and nothing being known about the future offshore developments in Arctic Russia it is difficult to estimate the amount of vessel days required in the Barents Sea. So we tried to play around with the numbers to estimate the total vessel days in the Arctic. If we estimate that 25% of the resources in the Barents Sea will be produced at a cost of 8 dollars a barrel, and that the SURF scope of that job is around 10%, then the amount of vessels days needed, if we use 2 vessel days pr. million in revenue will be 5 700 vessel days allocated to developing the Barents Sea. If we use an extraction rate of 50% the number of vessel days will top 11 000. When we not that those vessels not will be able to operate all year, we are talking about a substantial number of subsea oriented vessels. A development of the Kara Sea would substitute to more than 140 000 vessel days assuming a 50% extraction rate. The Russian market is characterized by public companies, very experienced in onshore drilling and field development, but lacking these skills when it comes to offshore developments. There are very few if any real subsea vessels in Russia. Most of the Russian offshore companies is partly or 100% owned by the Gazprom system. However, Russia has several shipyards with a proud history which should enable them to build these types of vessels as the oil and gas industry in Russia goes offshore. Rev 1

40
FORBEDRINGS INITIATIV
Teknologisk utvikling Bedre utførelse Klokere arbeidsform med kunder Bedre kapasitets utnyttelse

41
SUBSEA NÆRINGEN FREMOVER
Mest krevende og høyest risiko innen offshore entreprenør næringen Stor aktivitet i mange år fremover Dypere vann Fartøy balansen kan bli truet av nye konstruksjonsfartøy Bedre kapasitets utnyttelse - samarbeid Større kontrakter - konsolidering Korreksjon I finansmarkedet var på tide- åpner nye muligheter. TIME FOR ACTION

Liknende presentasjoner

. Panamakanalen/Vietnamkrigen. • 1970-tallet.>")


 Coast Seafood Sales / Marketing Coast USA Import / Wholesale Coast Australia.>")